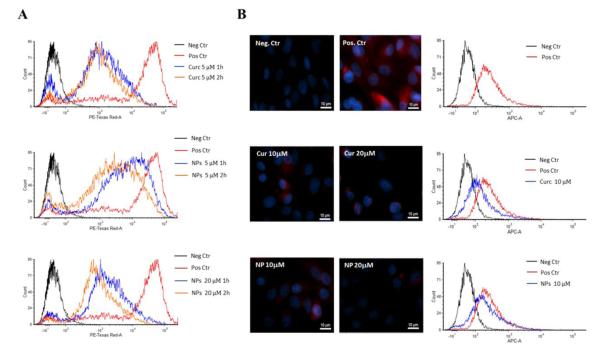
Figure.6. Flow cytometry and immunochemistry analysis for the adhesion molecules A.
Flow cytometry analysis for the ICAM-1 expression on HUVECs stimulated with TNF-α (Positive Control – red line); treated with free curcumin at 5 μM for 1h (blue line) and at 5 μM for 2 h (orange line) (up); treated with NANOCurc at 5 μM for 1h (blue line) and at 5 μM for 2h (orange line) (middle); and treated with NANOCurc at 20 μM for 1 (blue line) and at 20 μM 2h (orange line) (bottom). Fluorescence signals of positive control and treated cells were compared to negative control (black line) B. Immunochemistry analysis for the expression of MUC-1 on MDA-MB-231 cells: negative control (top left), positive control (top right); curcumin treated cells at 10 μM (middle, left) and 20 μM (middle, right); NANOCurc treated cells at 10 μM (bottom, left) and 20 μM (bottom, right). C. Flow cytometry analusis of the expression of MUC-1 on MDA-MB-231 in the case of no curcumin treatment (Pos. Ctr – red line); treated with free curcumin at 10 μM (blue line, middle graph), and treated with NANOCurc at 10 μM (blue line, bottom graph). Fluorescence signals of Pos. Ctr and treated cells were compared to Neg. Ctr (black line).

