
Figure 3.
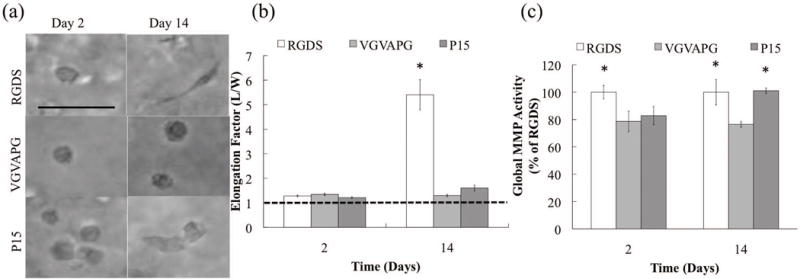
(a) Representative morphological images for each peptide on days 2 and 14. (b) Quantification of VIC elongation for each peptide as a function of culture time. Dotted line indicates a circular cell shape. (c) MMP Activity for each peptide as a function of culture time, which are normalized to the RGDS MMP activity on each day separately.