
Figure 6.
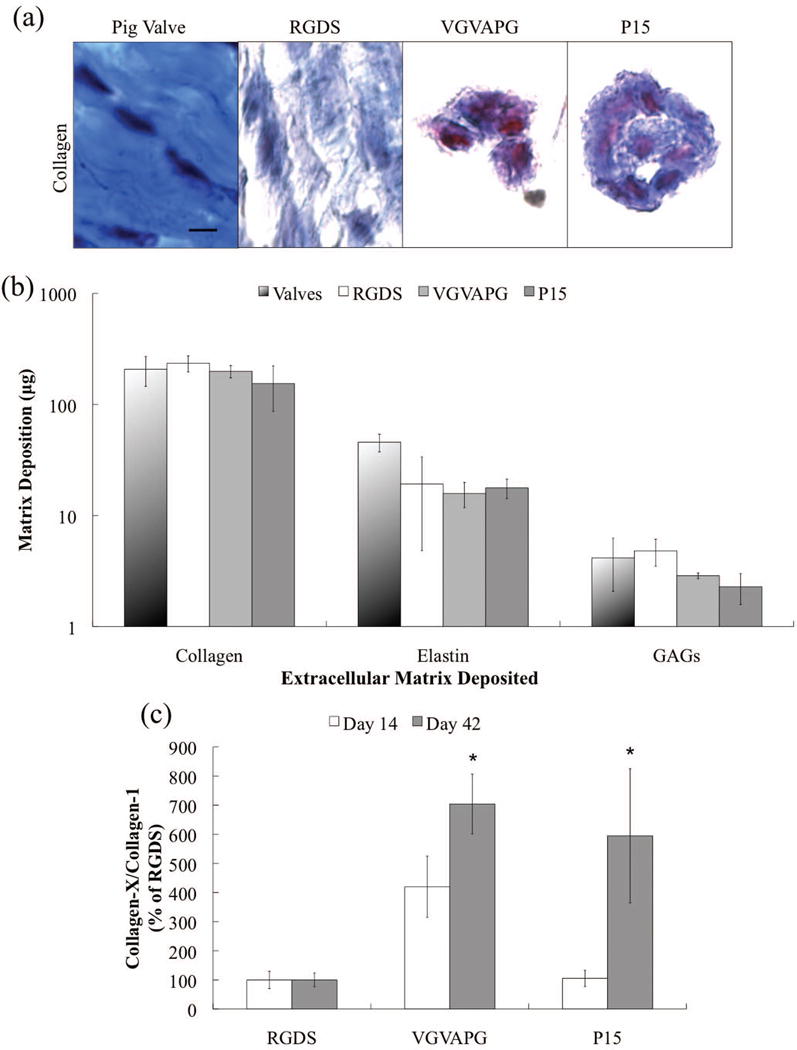
(a) Representative Masson’s Trichrome histology images for each peptide after 42 days and a native porcine aortic valve, with collagen deposition in blue and cytoplasm in red. No nonspecific staining of the remaining PEG hydrogel network was observed. Scale bar = 100 μm. (b) Mass (μg) of each type of ECM molecule deposited for each peptide after 42 days in culture. (c) The ratio of deposited collagen-X to collagen-1 as a percentage of the RGDS condition as a function of adhesive peptide 14 (white bars) and 42 (grey bars) days.