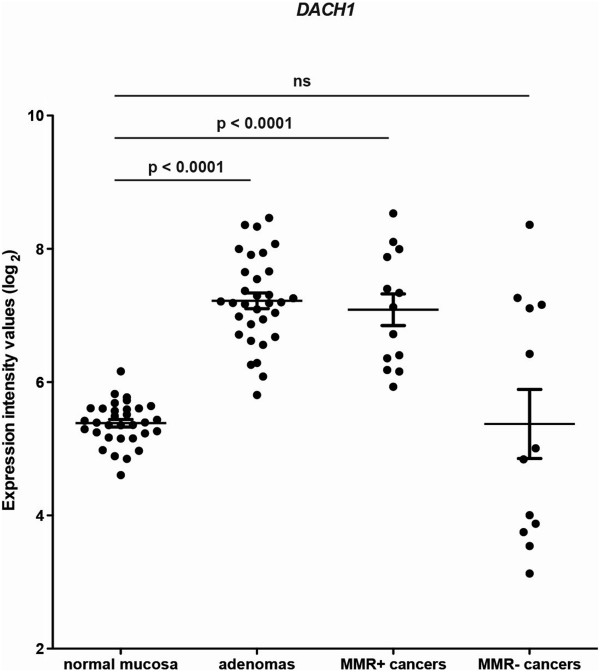
Figure 4.

DACH1 mRNA expression in normal colorectal mucosa, colorectal adenomas, and mismatch repair (MMR)-deficient and -proficient colorectal cancers. Scatter plot of normalized log2 expression intensity values for DACH1 (Affymetrix U133 Plus 2.0 array analysis) in the 4 tissue groups analyzed in our previous study [3]. Means and standard errors are represented by horizontal lines and t-bars, respectively.
