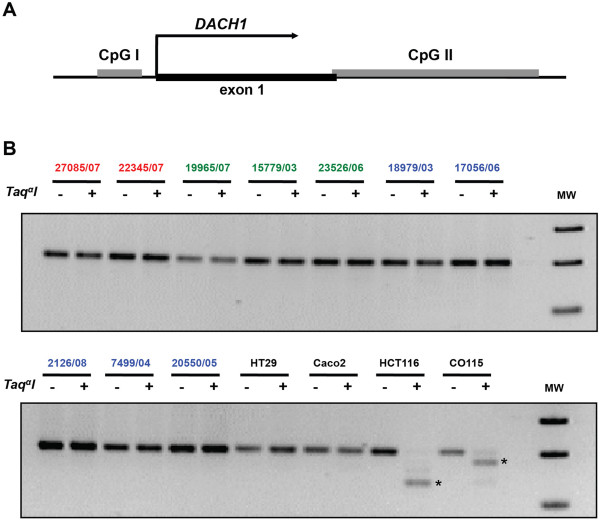
Figure 6.

Methylation analysis of the CpG island in the DACH1 promoter. (A): Schematic depiction of the CpG islands located respectively 5’ upstream from the DACH1 transcription start site (CpG I) and in the first intron of the DACH1 gene (CpG II). (B): Examples of CpG I COBRA analysis in colorectal cancers with intense (red), patchy (green), or no (blue) DACH1 protein immunostaining and in 4 colon cancer cell lines characterized by low (HT29 and Caco2) or very low (HCT116 and CO115) DACH1 expression (based on microarray-documented DACH1 mRNA expression levels - see also Additional file 9). Asterisks indicate TaqαI-digested DNA fragments representing methylated alleles; slower-migrating fragments correspond to undigested, unmethylated DNA. MW, molecular weight; bp, base pair.
