
Figure 2.
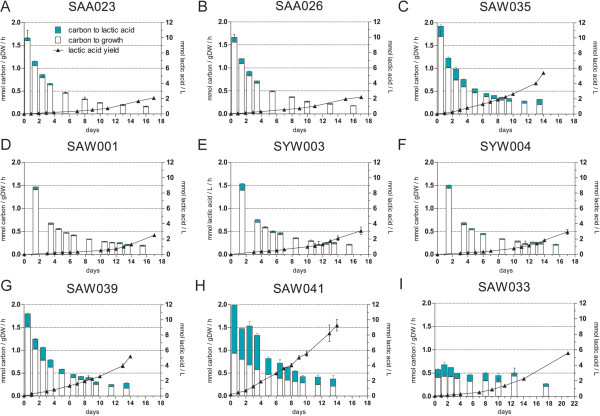
Growth and lactic acid production in Synechocystis mutant strains. (A-I) Fixed carbon partitioned into the biomass and into the product lactic acid (expressed in mmol carbon/gDW/h) at respective time intervals is shown on the left ordinate for different mutant strains expressing the LDH of L. lactis. Lactic acid production yield is specified by the right ordinate in mmol lactic acid/L. Error bars represent the SD of biological replicates (n = 3), except for SAW001, SYW003, and SYW004 where n = 2; if error bars are not visible, they are smaller than the data point symbol. Strain numbers are indicated above each panel, and the corresponding genotypes are given in Table 1.