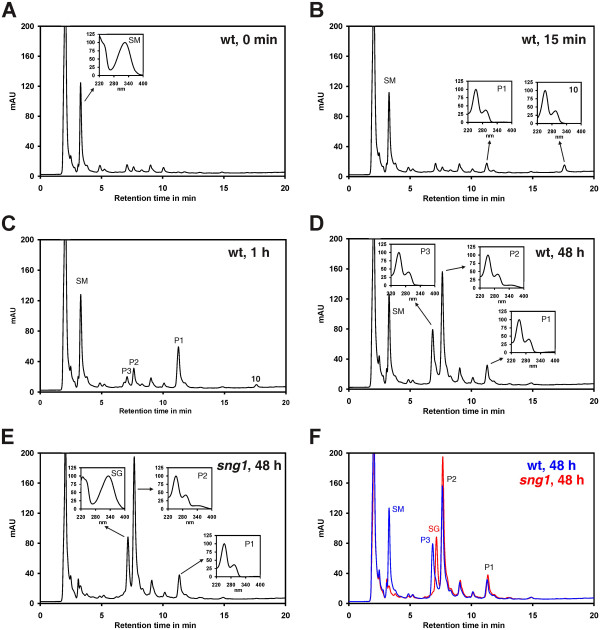
Figure 5.

Methylated compounds are rapidly hydrolysed in planta. A. thaliana Col-0 seedlings were infiltrated with a solution containing 50 μM compound 10. (A) Control samples were taken before infiltration and analysed by HPLC. (B) Already after 15 min a second peak designated P1 appeared. (C) After 1 h two additional peaks, P2 and P3 were visible, (D) which became even more pronounced after 48 hours. (E) The same experiment was performed with sng1 mutants. The chromatogram obtained with the sample taken after 48 h is shown. (F) Overlay of the 48 h chromatograms of the Col-0 sample and the sng1 sample. The small boxes inserted into the chromatograms show the UV spectra of the peaks in the range of 220 to 400 nm. SM, sinapoylmalate; SG, sinapoylglucose; mAU, milli absorption units recorded at 250 nm.
