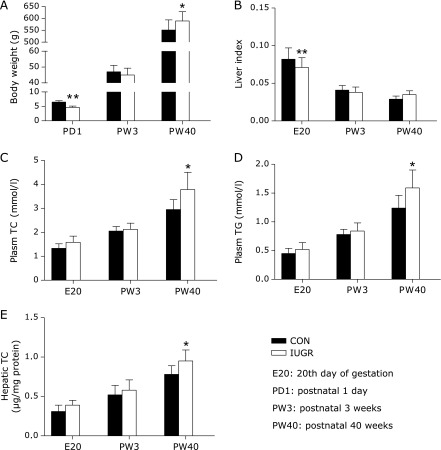
Fig. 1.
The influence of maternal protein restriction on offspring liver growth and metabolic profile. (A) Body weight of offspring rats at postnatal day 1 (PD1) (control, n = 93; and IUGR, n = 108), PW3 (control, n = 52; and IUGR, n = 48) and PW40 (control, n = 10 and IUGR, n = 12). (B) Liver weight is expressed as a percentage of body weight at E20 (control, n = 42; and IUGR, n = 45), PW3 (control, n = 8 and IUGR, n = 8) and PW40 (control, n = 8; and IUGR, n = 8). (C)–(E) Fasting plasma triglyceride (TG), total cholesterol (TC), and hepatic TC concentrations in all time points examined (n = 6 for both groups). Black bars, control group; white bars, IUGR group. Data are shown as means ± SE. Significant differences compared with controls of same age are indicated by *p<0.05 and **p<0.01.

