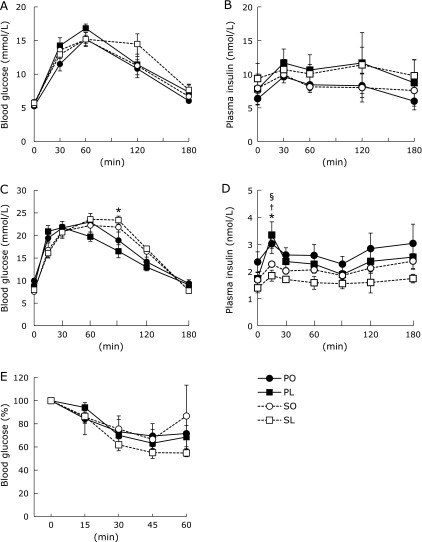
Fig. 1.
Glucose tolerance and whole body insulin sensitivity. OGTT was performed at 3 weeks (A and B) and 4 weeks (C and D). Plasma glucose and insulin levels were measured in a blood sample collected at each indicated time after glucose administration (2 g/kg BW). (E) ITT was performed at 4 weeks. Plasma glucose levels at each indicated time were represented as the percent of the value at time 0. Results were means ± SEM (n = 5–6). *p<0.05 vs PL group for SL group, †p<0.05 vs PO group for PL group, and §p<0.05 vs PL group for SO group.

