
Fig. 2.
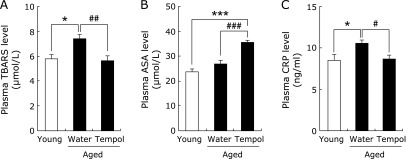
Effect of tempol on plasma TBARS (A), ascorbic acid (B), and CRP (C) levels. Open and closed column represents young (n = 7) and aged (n = 8) mice, respectively. *p<0.05 and **p<0.005 vs young group. #p<0.05, ##p<0.01, and ###p<0.005 vs aged control group.