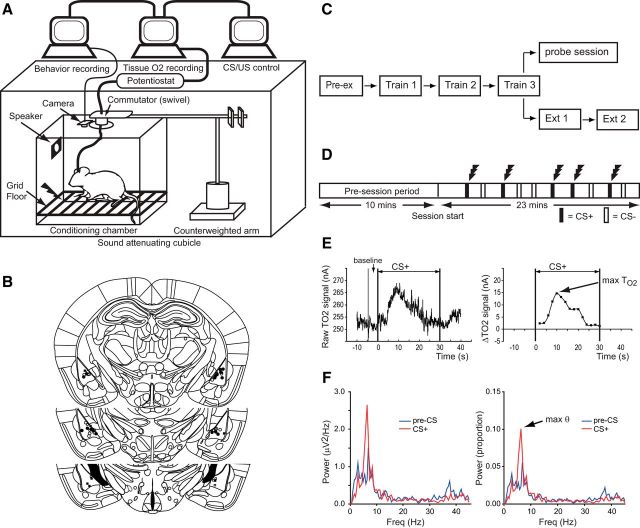
Figure 1.
Experimental design and histology. A, Diagram of the recording setup. B, Reconstructions of electrode placements in the basolateral amygdala. Filled circles/squares = TO2 electrodes, open circles/squares = LFP electrodes. Circles denote mice that underwent extinction; squares denote mice that underwent the probe session containing expected and unexpected shocks. C, Schematic of the experimental sessions. Twenty-four mice underwent fear conditioning, eight of these also underwent the probe session. The remaining 16 mice underwent one extinction session, with 10 of these doing two sessions. D, Fear conditioning sessions consisted of a 10 min pre-session period, followed by a 23 min session with 10 auditory cues (5 × tone, 5 × white noise), presented in pseudorandom order. On training days, one of the cues (CS+) was always paired with coterminating footshock; the other cue (CS−) was never paired with footshock. No shocks were given during the pre-exposure or extinction sessions. During the probe session three CS+ (with shock), three CS− (no shock), and three unsignaled shocks were given. E, Left, Example of raw TO2 data during a CS+ presentation (CS onset at 0 s, offset at 30 s). E, Right, TO2 data transformed into ΔTO2 signal by subtracting the baseline (mean TO2 signal in the 5 s before CS onset) and binning the raw TO2 signal into fifteen 2 s epochs. Arrow shows the peak TO2 signal. F, Left, Example power spectral density (PSD) for an LFP signal in the pre-CS+ period (blue trace), and the CS+ period (red trace). F, Right, Proportional PSD calculated by expressing the power in each frequency bin as a proportion of the total power between 1 and 45 Hz. Arrow shows peak theta power.

