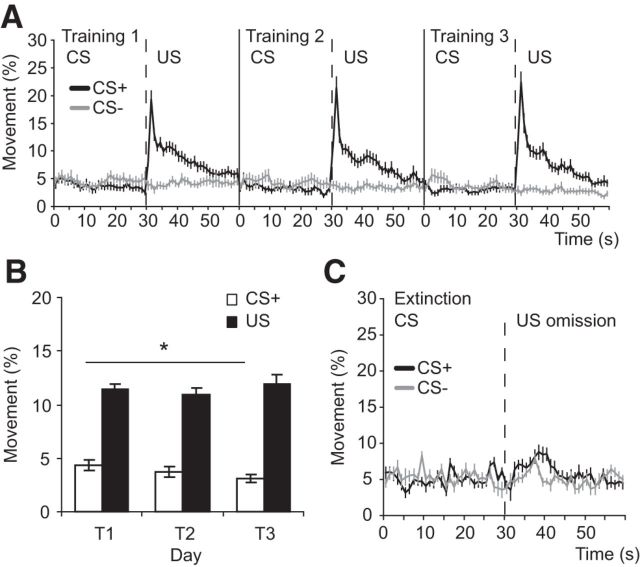
Figure 4.
Locomotor activity during aversive CS+ and US presentations could not explain the patterns of amygdala TO2 responses or theta oscillations. A, Locomotor activity during the 30 s CS+ presentation and the 30 s post-US period (black trace) for T1–T3. Movement during CS− and the equivalent no US period is shown for comparison (gray trace). The burst in activity at ∼30 s in the black trace is in response to the footshock US. B, The magnitude of the CS+ evoked locomotor response decreased over training (*p < 0.05), whereas TO2 responses and theta oscillations significantly increased over training. Also, US evoked locomotor responses stayed constant over training, whereas TO2 responses and theta oscillations significantly decreased over training (Fig. 2). C, Locomotor activity during CS+ and CS− trials and the post-CS period during extinction trials. There was a slight increase in movement following US omission on CS+ trials (black trace from 30 to 40 s), whereas TO2 signals and theta oscillations decreased during this period. A–C, Mean ± SEM. A, B, n = 24 mice; C, n = 10 mice).

