Figure 6.
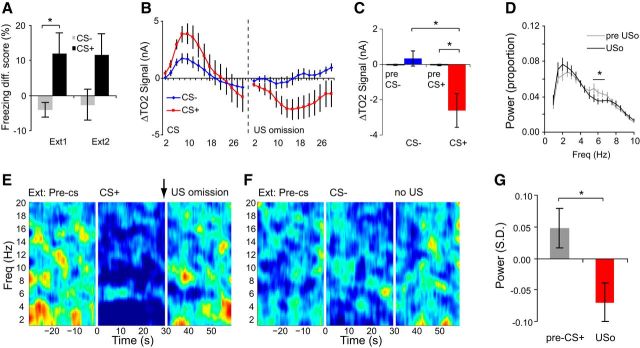
Negative aversive prediction signals in the amygdala during fear extinction. A, Freezing responses during CS+ or CS− cues for extinction days 1 and 2 (Ext1, Ext2). B, C, TO2 signals evoked by the absence of an expected footshock (US omission) were significantly lower than pre-US omission baseline signals and the pre-CS+ baseline. This was not the case for the equivalent CS− period. D, Power spectra illustrating lower theta power in the 10 s following US omission (USo, black line) versus the 10 s before US omission (pre-USo, gray line). E, Z-transformed, group-averaged spectrogram illustrating increased theta power in a narrow frequency range (∼6 Hz) during CS+ presentation and the marked decrease of activity in this range following US omission. F, As in E, but for the equivalent CS− period. G, Theta activity at 6 Hz (expressed in SD units) was significantly lower following US omission compared with the pre-CS+ period. A–D, G, Mean ± SEM. A–C, n = 10 mice, D–G, n = 16 mice; *p < 0.05.

