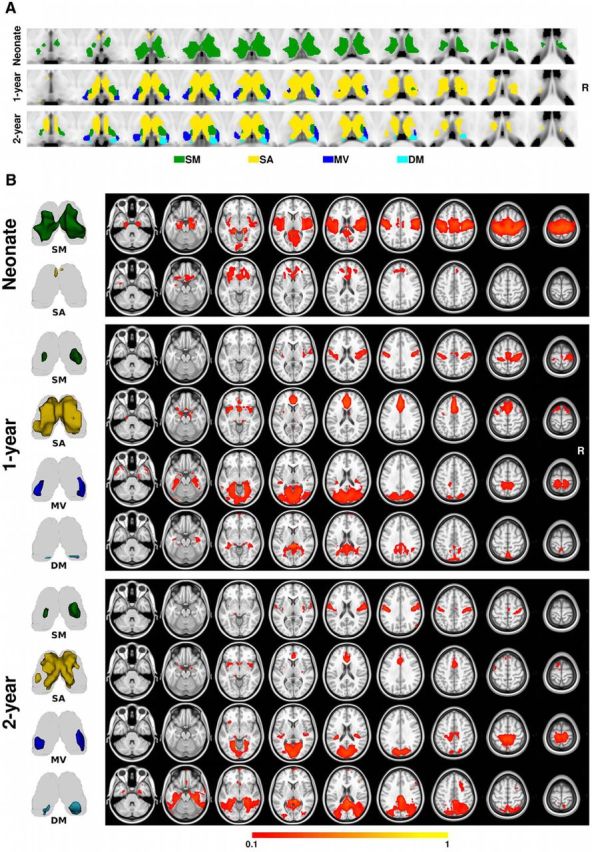
Figure 3.

Thalamus parcellation and thalamocortical projection patterns for all three age groups. A, Thalamus parcellation scheme based on the pooled large sample. B, Cortical connectivity patterns associated with each thalamic cluster in A. The 3D rendering of each thalamic cluster is visualized alongside its cortical projection map for easier interpretation. Color bar denotes connectivity strength. The right side of the brain is on the right side of the image. SM, Sensorimotor; SA, salience; DM, default mode; MV, medial visual.
