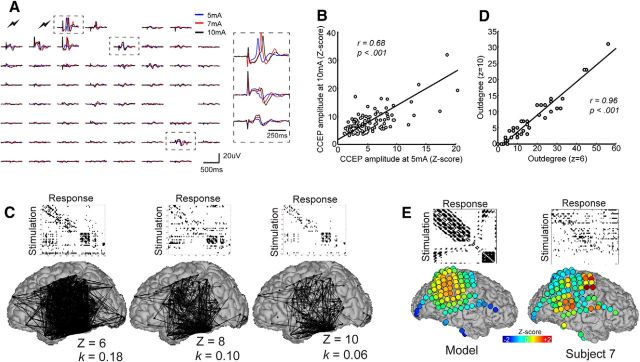
Figure 3.
Effect of stimulation intensity and threshold on CCEP networks. A, Spatial distribution of CCEPs elicited from stimulation of different intensities. CCEPs from three regions (dotted black boxes) are expanded on the right. B, Relationship of CCEP strength for 5 and 10 mA current intensities. C, Relationship of CCEP threshold to network density (k). As threshold increases, the network becomes sparser and density decreases. D, Effect of CCEP threshold on outdegree measures. E, Effect of distance on outdegree. A null model based on CCEP responses that are inversely proportional to distance from the stimulation site compared with empirical data from Subject 7. Warm colors denote regions with high outdegree (as expressed by Z-score after normalizing outdegree measures across all sites).

