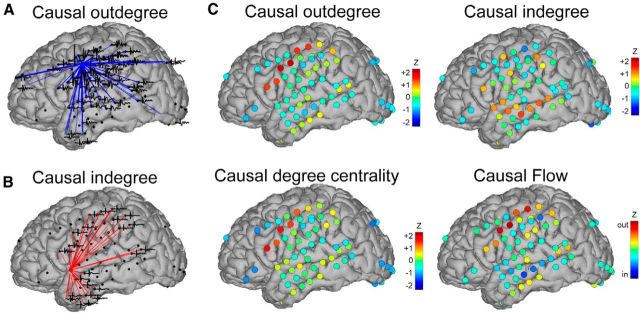
Figure 5.
Graph theory measures in one subject. Examples of nodes with high causal (A) outdegree and (B) indegree. For each brain, only suprathreshold CCEPs are plotted and represented with a line connecting the stimulating electrode to the response site. C, Network measures across all stimulation sites. Network measures are represented at each node with a heat map according to its z-thresholded network measure.

