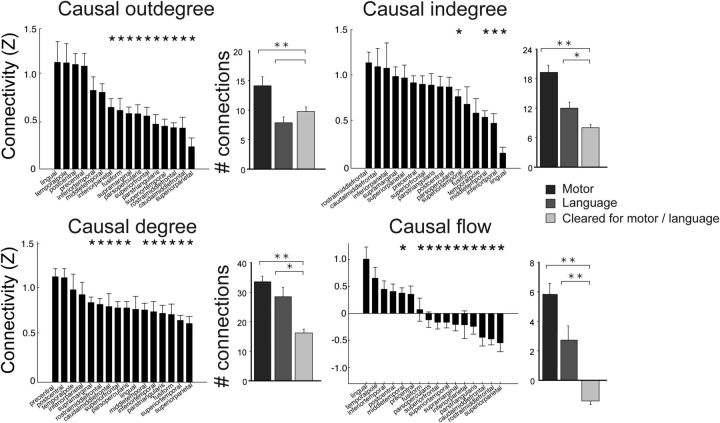
Figure 7.
Functional and anatomical network analysis across subjects. Causal outdegree, indegree, degree, and flow for each subject are normalized and averaged. The bar graph on the left of each network measure compares the relationship between anatomical regions and Z-score normalized connectivity across subjects. Mean network measures from electrodes found within cortical regions defined by an automated parcellation. Regions with <4 electrodes were discarded from the analysis. Each area was compared with the region with the most positive connectivity (leftmost bar) in each category. The bar graph on the right represents the relationship between corticocortical connectivity and functional regions (as defined by ESM) across subjects. Number of electrodes used for ESM analysis: N = 94 (motor response), 37 (language response). Error bars represent SEM; *p < 0.05, **p < 0.01, unpaired t test.

