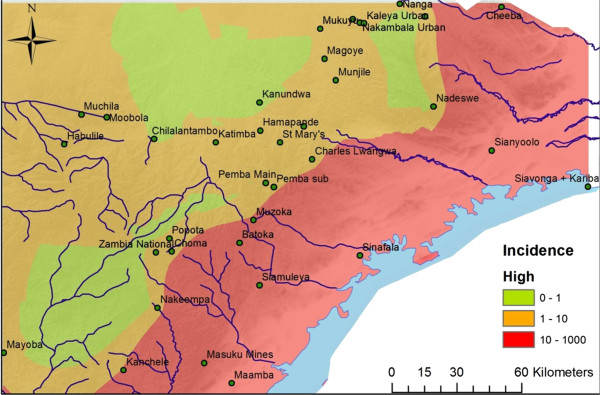
Figure 3.

Study area– high season incidence map. Showing a Kriging interpolation of rural health centre (RHC) incidence data from the wet, high seasons of 2011-2013. The different colours indicate the transmission pattern at the 38 RHCs in Southern Province, Zambia.
