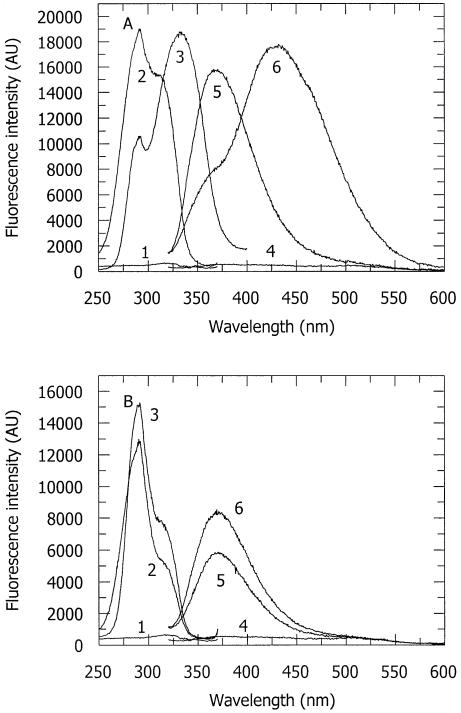
Figure 1.
Fluorescence excitation and emission spectra of 2-AP incorporated in various DNA duplexes. Curves 1, 2 and 3 are excitation spectra and 4, 5 and 6 are emission spectra. (A) Spectra of 2-AP in duplex 1 (i.e. having 2-AP at the position of CH3 addition, Table 1). Spectra 1 and 4, DNA duplex 1 only; spectra 2 and 5, DNA duplex 1 with M.EcoKI; spectra 3 and 6, complex of DNA duplex 1 with M.EcoKI and AdoMet taken after a 15 min incubation period with AdoMet. In these spectra, the weak buffer background and Raman scattering have been subtracted. (B) Spectra of 2-AP in duplex 5 (i.e. having 2-AP adjacent to the position of CH3 addition, Table 1). Spectra 1 and 4, DNA duplex 5 only; spectra 2 and 5, DNA duplex 5 with M.EcoKI; spectra 3 and 6, complex of DNA duplex 5 with M.EcoKI and AdoMet taken after a 15 min incubation period with AdoMet. In these spectra, the weak buffer background and Raman scattering have been subtracted.

