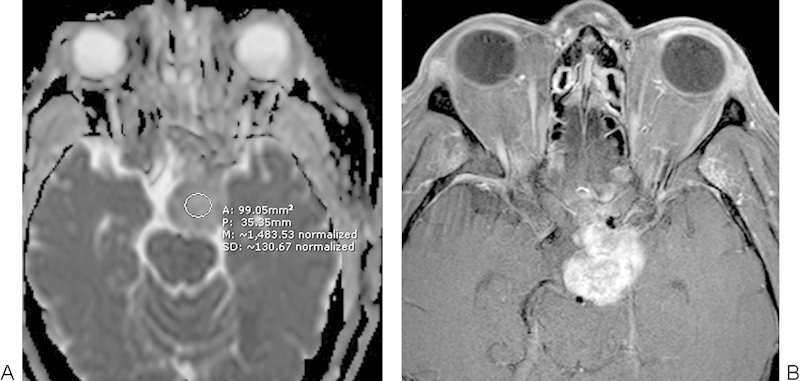
Fig. 10.

Conventional chordoma. (A) Apparent diffusion coefficient map with a sample region of interest shows relatively elevated diffusivity in the exophytic clival mass. (B) The corresponding T1-weighted image shows avid enhancement within the mass.
