Figure 3.
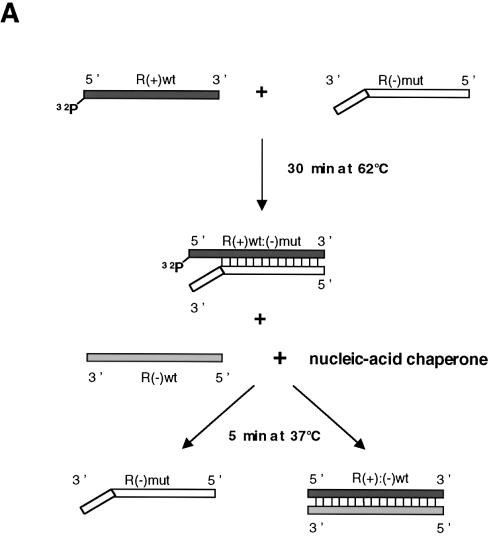
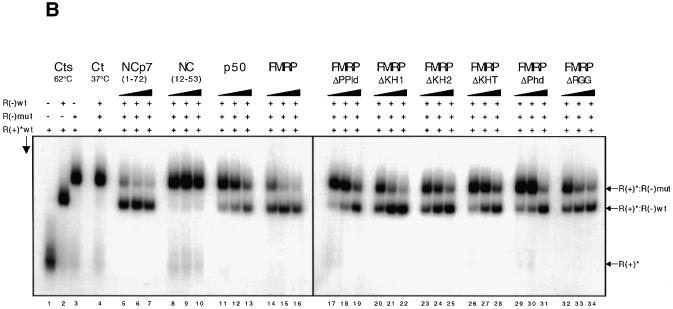
FMRP activates DNA strand exchange. (A) Schematic representation of the assay. DNA sequences corresponding to the HIV-1 R region of 96 nt in length. 5′ 32P-labelled R(+).wt was hybridized to R(–).mut to generate a double-stranded DNA with seven mismatches at one end (step 1). R(–).wt completely complementary to R(+).wt is added together with HIV-1 NCp7 or FMRP (step 2). Strand exchange is visualized by native 6% PAGE in 0.5 TBE. (B) Strand exchange assays. Conditions were as described in Materials and Methods. Proteins are indicated at the top of the figure. *R(+) is the 32P-labelled DNA. Double-stranded [*R(+):R(–).wt] and [*R(+):R(–).mut] are indicated on the right. Percentages of strand exchange were assessed by PhorphorImaging and are indicated in parentheses (see below). The vertical arrow shows the direction of electrophoresis. Lanes 1 and 2, *R(+).wt alone and annealed to R(–).wt. Lane 3, *R(+) hybridized to R(–).mut. Lane 4, [*R(+):R(–).mut] incubated with R(–).wt at 37°C for 30 min. Protein to nucleotide molar ratios were 1:8, 1:4 and 1:2 corresponding to a protein concentration of 1, 2 and 4 × 10⁻⁷ M, respectively. NCp7, lanes 5–7 (64, 75 and 78%); NC(12–53), lanes 8–10 (4, 5 and 6%); p50, lanes 11–13 (22, 32 and 50%); FMRP wild type, lanes 14–16 (53, 70 and 78%); FMRP ΔPPId, lanes 17–19 (19, 31 and 62%); FMRP ΔKH1, lanes 20–22 (44, 61 and 73%); FMRP ΔKH2, lanes 23–25 (40, 54 and 65%); FMRP ΔKHT, lanes 26–28 (24, 39 and 53%); FMRP ΔPhd, lanes 29–31 (26, 32 and 60%); FMRP ΔRGG, lanes 32–34 (39, 53 and 60%). Note that FMRP displays greater DNA strand exchange activity than YB-1/p50 but is similar to HIV-1 NCp7. FMRP variants ΔPPId, ΔKHT and ΔPhd display a DNA exchange activity ∼2.5-fold lower than wild-type FMRP.


