
Fig. 3.
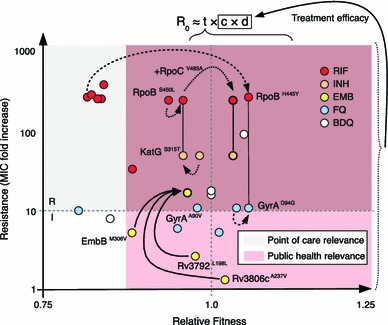
Evolutionary trajectories of epistasis-driven resistance. The relative fitness of strains carrying key drug-resistance mutations grown in the absence of drug was plotted against their contribution to MIC to illustrate the relationship between genotype and phenotype for important drug-resistance mutations. Lines connecting individual mutations denote strains carrying two mutations, while arrows denote estimates of the fitness of double/triple-mutants (three different types of arrows are used to illustrate different evolutionary trajectories). Reproductive number (R 0) defined as the number of secondary cases caused by an infected individual is roughly equal to the product of an organism’s transmissibility (t), number of contacts (c), and the duration of infection (d). Fitness estimates were summarized from Gagneux et al. [45] (RIF, M. tuberculosis), Borrell et al. [46] (FQ, Msm), Safi et al. [47] (EMB, M. tuberculosis), and Huitric et al. [85] (BDQ, M. tuberculosis). We were unable to find true relative fitness measurements for KatG S315T and GyrA A90V; these were estimated from Pym et al. [95] and Poissy et al. [96]. Fold increases in MIC shown are averages of values obtained from Sougakoff et al. [97–99], Pang et al. [97–99], and Anthony et al. [97–99] for RIF; Pym et al. [95] for INH; Safi et al. [47, 100, 101], Plinke et al. [47, 100, 101], and Starks et al. [47, 100, 101] for EMB; Aubry et al. [94, 102–105], Matrat et al. [94, 102–105], Cheng et al. [94, 102–105], Duong et al. [94, 102–105], and Malik et al. [94, 102–105] for FQ; and Huitric et al. [85] for BDQ. BDQ bedaquiline, EMB ethambutol, FQ fluoroquinolones, INH isoniazid, MIC minimum inhibitory concentration, RIF rifampicin