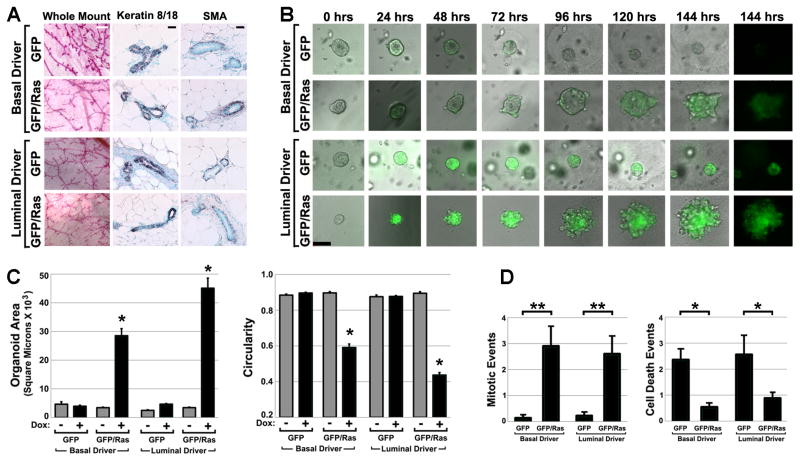
Figure 2. H-RASG12V expressed in either MEC compartment drives organoid overgrowth.
(A) Normal histomorphology of Dox-naïve transgenic mammary glands. Representative images of camine-stained mammary gland whole mounts and immunohistochemically stained tissue sections are shown. White bar, 500 μm; black bar, 100 μm. (B) Time-lapse imaging of organoid overgrowth. Organoids prepared from Dox-naïve mice engineered for Ras pathway activation in either basal MECs (K5-rtTA/TGFP/TRAS; BasalRAS/GFP) or luminal MECs (MMTV-rtTA/TGFP/TRAS; LuminalRAS/GFP) were cultured concurrently in 3D along with genetic control organoids lacking the TRAS transgene (BasalGFP and LuminalGFP). Sequential images of representative organoids of each genotype captured during a one week live-cell imaging experiment are shown. Times denote hrs after Dox addition. Bar, 50 μm. (C) Ras-mediated changes in organoid size and shape. 2D organoid images captured after 6 d Dox treatment were subjected to morphometric analysis to determine mean organoid area (left) and circularity (right). Mean values reflect analysis of 23 to 111 organoids for each genotype and treatment condition. (D) Ras-mediated increases in MEC proliferation and survival. Organoid videos were viewed frame-by-frame to score mitotic (left) and cell death (right) events occurring during the first 2 days of Dox treatment. Mean values reflect indices (events per organoid, normalized to a 24 hour acquisition period) derived from analyzing videos from 8 to 38 organoids of each genotype. *, p < 0.01; **, p < 0.05; Kruskal-Wallis analysis of variance, Tukey-Kramer method. All error bars indicate SEM.

