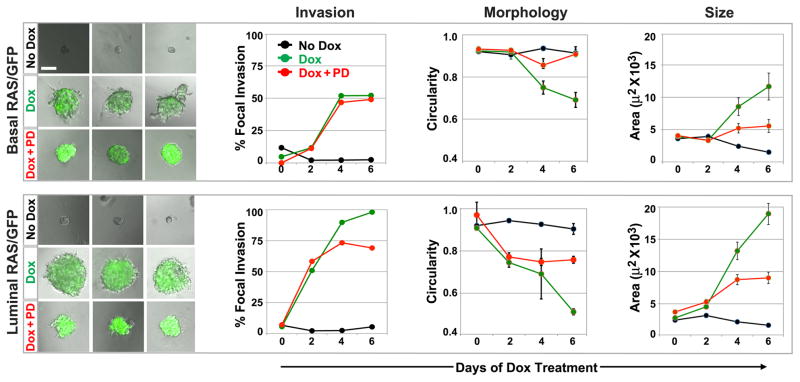
Figure 4. MEK inhibition partially blocks Ras phenotypes in both MEC compartments.
BasalRAS/GFP and luminalRAS/GFP organoids were cultured under the indicated treatment conditions for 6 d. PD denotes MEK inhibitor PD0325901 at 100 nM. Left panels depict day 6 images (10X) of representative organoids for each genotype and treatment condition (see also Videos 5 and 6). Morphometry of 2D images captured at days 0, 2, 4 and 6 were used to determine the prevalence of focal invasion, as well as the mean organoid circularity and area at each time point. Each data point reflects the analysis of 37 to 55 organoids. Error bars denote SEM.

