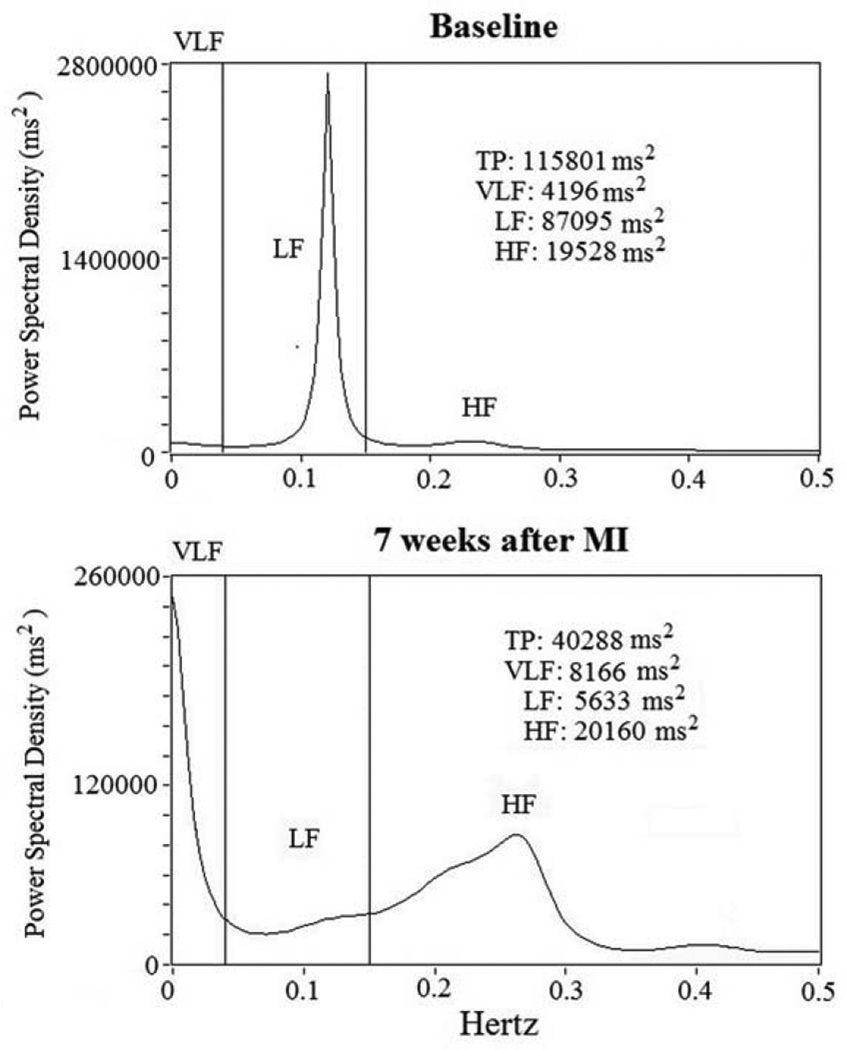
Figure 2.
RR power spectral analysis at baseline and 7 weeks after acute myocardial infarction (MI). Short-term power spectral analysis components are very-low frequency (VLF), low-frequency (LF) and high-frequency (HF) power components. Total power was almost all area-under-the-curve (0 to 0.40 Hz). After MI, total power (TP) and low-frequency (LF) power diminish from baseline.

