Figure 2.
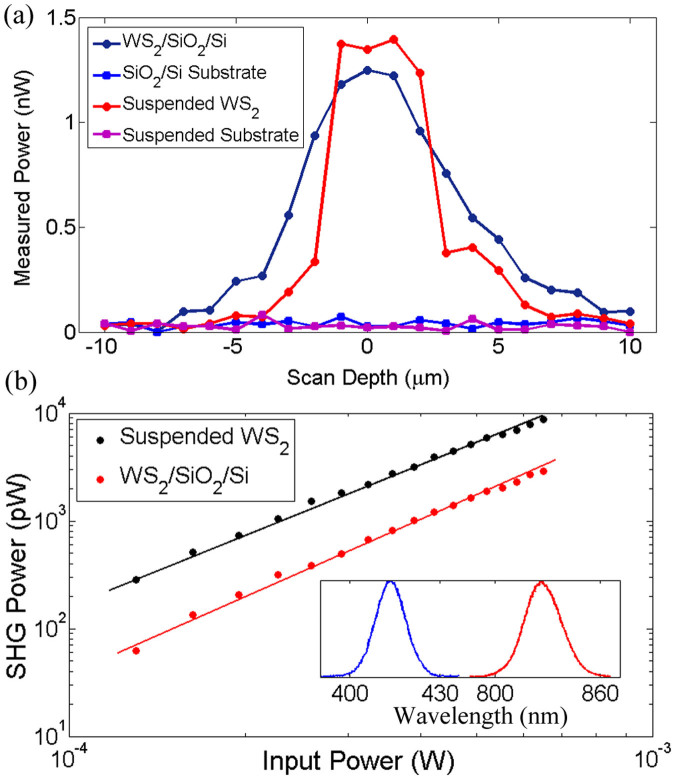
(a) SHG scan with sample translated along the axial direction. The distance is relative to the surface of the substrate. The vertical axis shows the SH signals generated from WS2 on a SiO2/Si substrate (average incident power = 1 mW) and suspended on a TEM grid (average incident power = 0.7 mW), as well as SH signals for the bare SiO2/Si substrate and TEM grid, by focusing the fundamental beam to different depths. There is no detectable SHG signal from the bare substrate without the WS2 triangular monolayer, thus allowing all the SH signal generated at the surface of the sample to be attributed to the presence of WS2. (b) Power dependence of the SH signal generated from a triangular WS2 monolayer in a logarithmic scale on both the suspended and the SiO2/Si substrate. The measured power is shown as points and the linear fit is plotted as a solid line. The bottom inset shows the normalized fundamental laser spectrum and a typical normalized spectrum of the SH signal generated from a WS2 monolayer.

