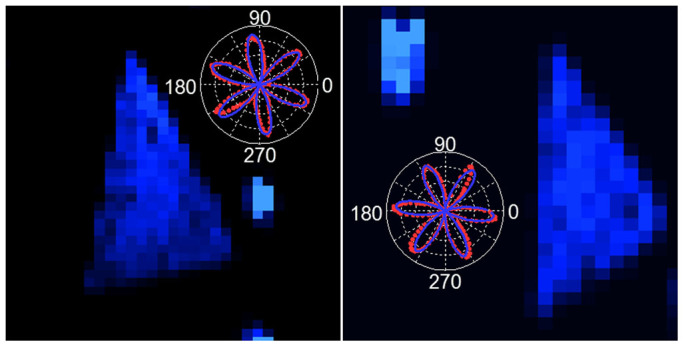
Figure 3. Polarized SHG in WS2 triangles.

The SHG images show two monolayer WS2 triangles on the same SiO2/Si substrate. The polar plots show the normalized polarization dependence of SHG in WS2 monolayer islands. Dots are measured data and the solid curves are the theoretical fit. The two polar plots reveal a rotation of 18 degrees between the two triangles.
