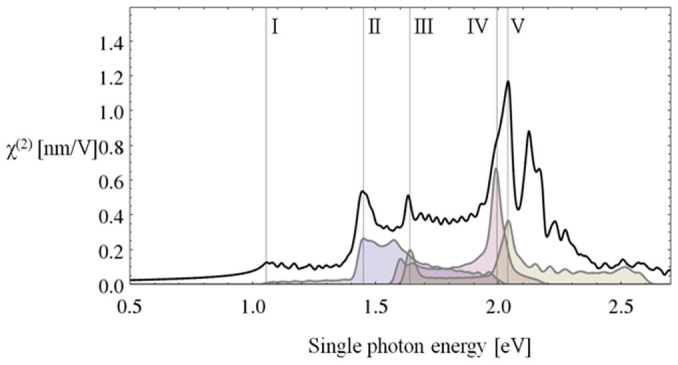
Figure 5. The nonlinear susceptibility χ(2) of monolayer WS2.

Also shown is the colour-coded joint density states contributions from the highest valence band to the first, second, and third conduction bands, aligned to the calculated spectra at the appropriate second-order resonant frequencies and following the colour scheme of Fig. 4.
