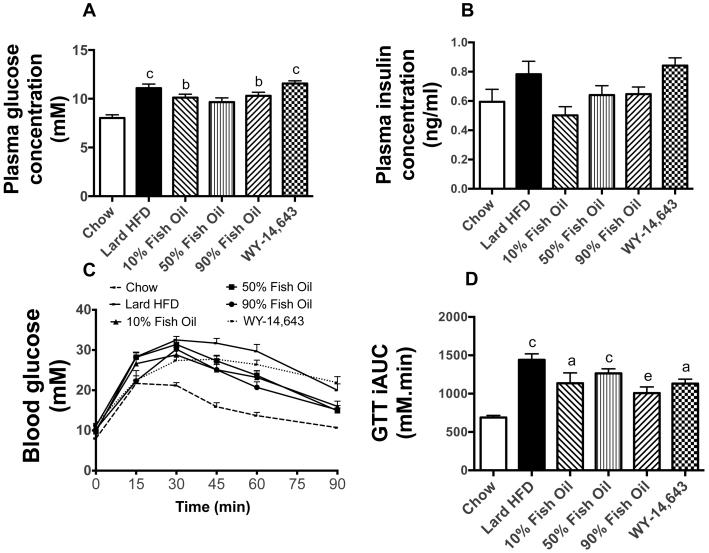
Figure 1. Glucose metabolism measures in chow, lard-HFD, fish oil-fed and WY-treated mice.
Basal plasma glucose (A) and insulin (B) levels. An intraperitoneal glucose tolerance test (C) was performed in mice that were fasted for 6 hours prior to receiving a glucose bolus (2 g/kg). (D) The incremental area under the curve (iAUC) indicates the animal's ability to clear the glucose load from the circulation. Shown are means ± SEMs, with n = 8–10 mice per group; a,b,c p < 0.05, 0.01, 0.001 vs chow; d,e p < 0.05, 0.01 vs. lard-HFD.

