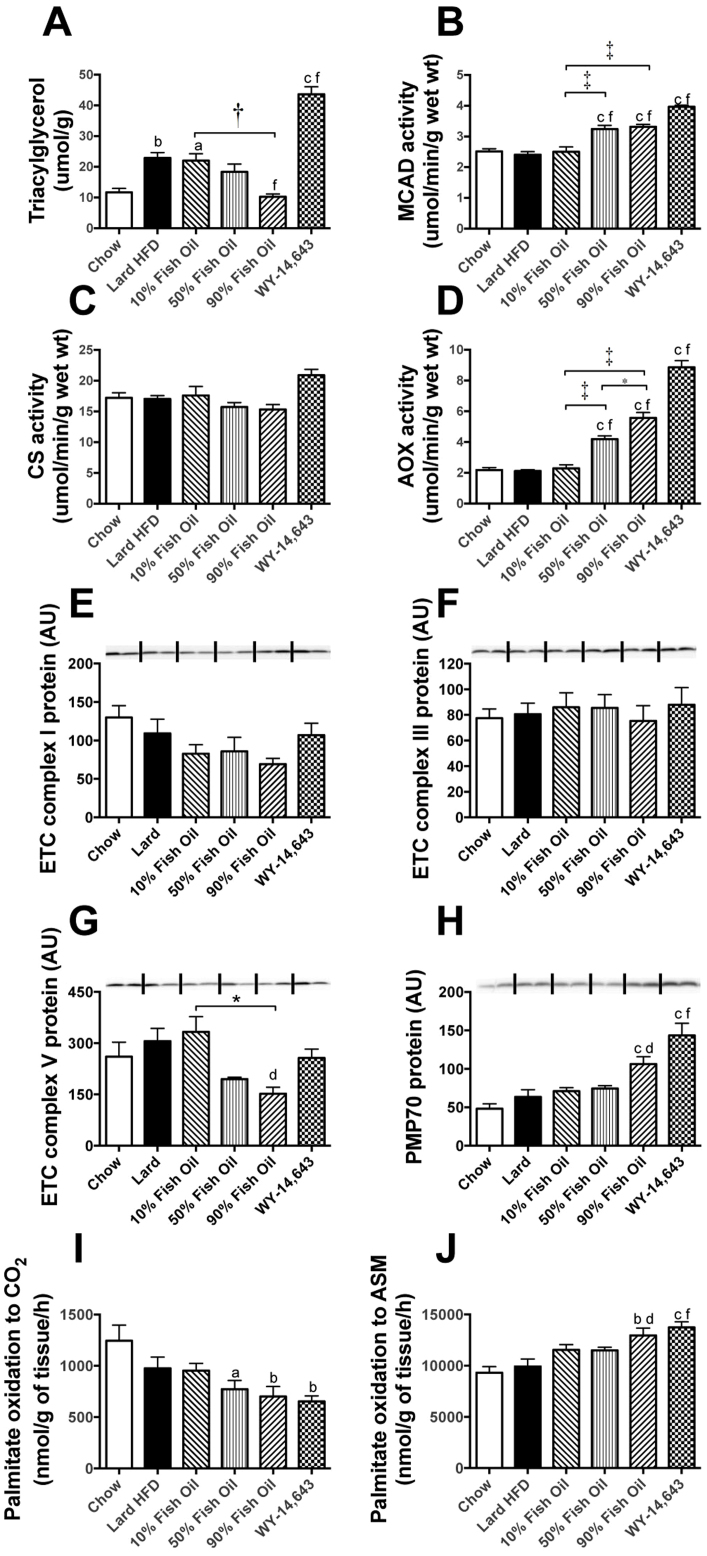
Figure 3. Markers of lipid metabolism in liver.
Triacylglycerol content (A) was used as a measure of lipid accumulation. The activity of medium chain acyl coenzyme A dehydrogenase (MCAD, B), citrate synthase (CS, C) and acyl-CoA oxidase (AOX, D) were determined in liver homogenates as described previously16. Protein levels of oxidative and peroxisomal markers in liver were measured by immunoblotting (E–H) as described in8,53. Oxidation of [1-14C]-palmitic acid to CO2 (I) and acid-soluble metabolites (ASM, J) was assessed in liver homogenates. Shown are means ± SEMs; with n = 8–10 mice per group. Representative immunoblots show n = 2, with densitometry calculated for n = 8–10 per group. a,b,c p < 0.05, 0.01, 0.001 vs chow; d, f p < 0.05, 0.001 vs lard-HFD; * p < 0.05, † p < 0.01, ‡ p < 0.001. Complex I, III and V represent sub-units of the complexes of the electron transport chain (ETC), PMP70 = peroxisomal membrane protein 70. AU – Arbitrary units.

