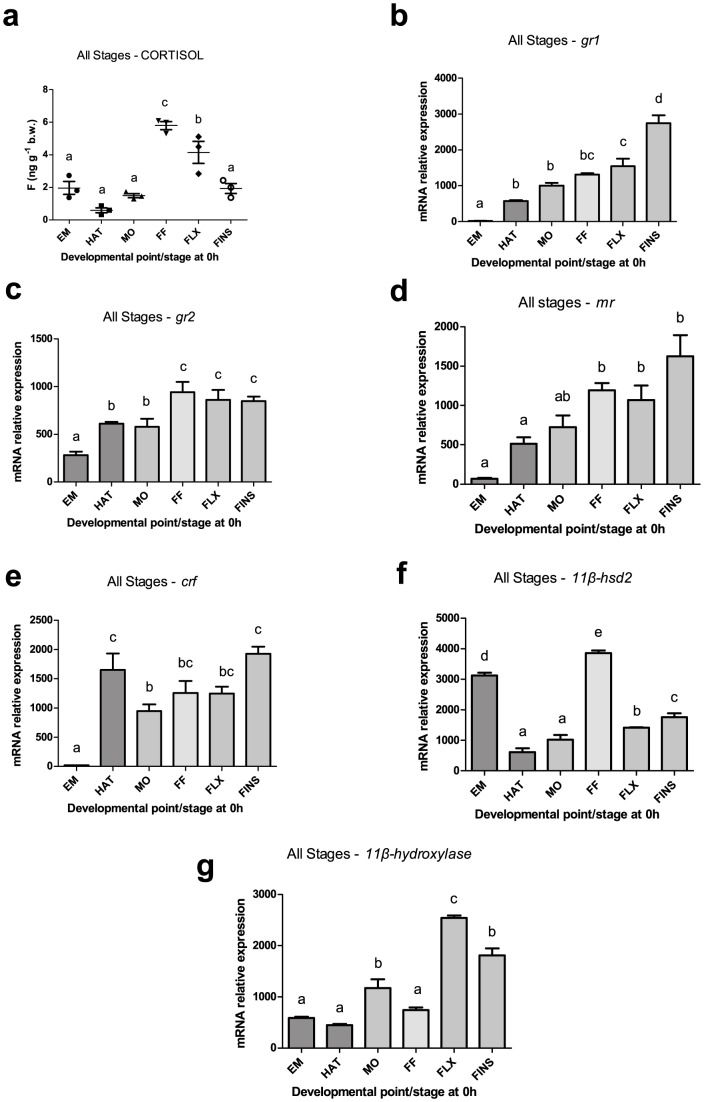
Figure 2. Temporal patterns of cortisol content and gene expression at early ontogeny.
Changes in resting (0 h) whole body cortisol levels and mRNA transcript levels of gr1, gr2, mr, crf, 11β-hsd2 and 11β-hydroxylase during the different developmental points/stages (embryos-EM, hatch-HAT, mouth opening-MO, first feeding-FF, flexion-FLX, formation of all fins-FINS). Values are means ± standard error (n = 3). Means with different letters differ significantly from one another (P < 0.05).

