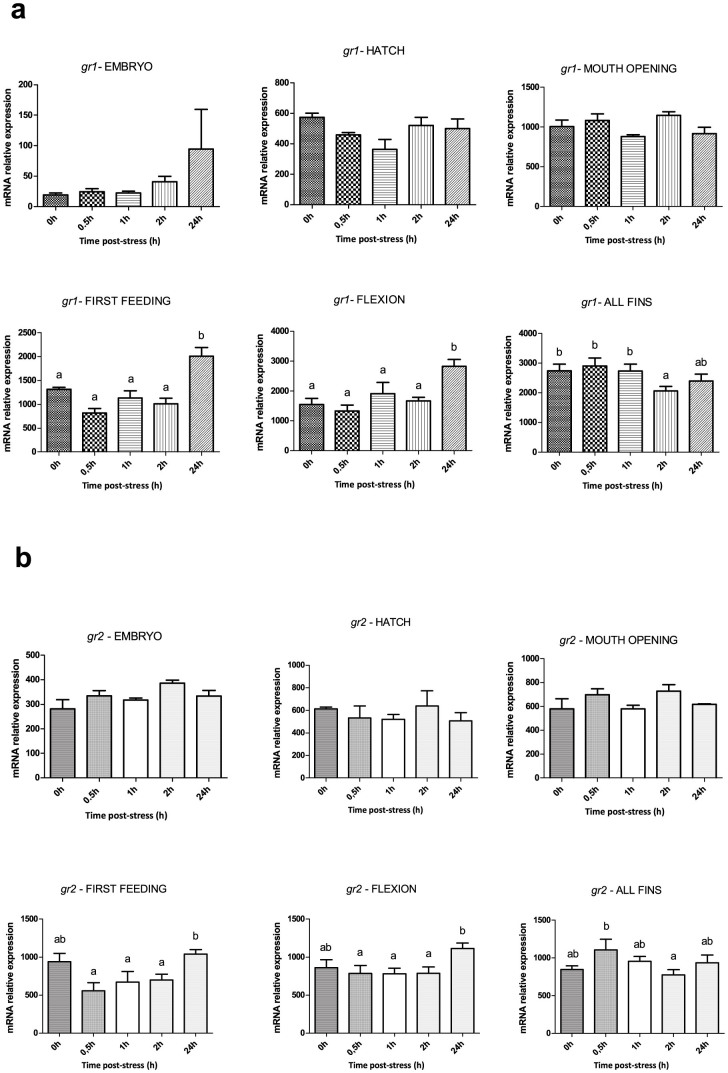
Figure 4. Expression of gr1 and gr2 after application of a stressor during early ontogeny.
(a) Expression profile of gr1 prior to (0 h) and after (0.5 h, 1 h, 2 h and 24h ) the application of the stressor at the different developmental points/stages. (b) Expression profile of gr2 prior to (0 h) and after (0.5 h, 1 h, 2 h and 24 h) the application of the stressor at the different developmental points/stages. Values are means ± standard error (n = 3 pools of ca. 30 mg for embryos, hatched eggs and larvae samples, apart from juveniles where pools of 1–2 fish were used). Means with different letters differ significantly from one another (P < 0.05).

