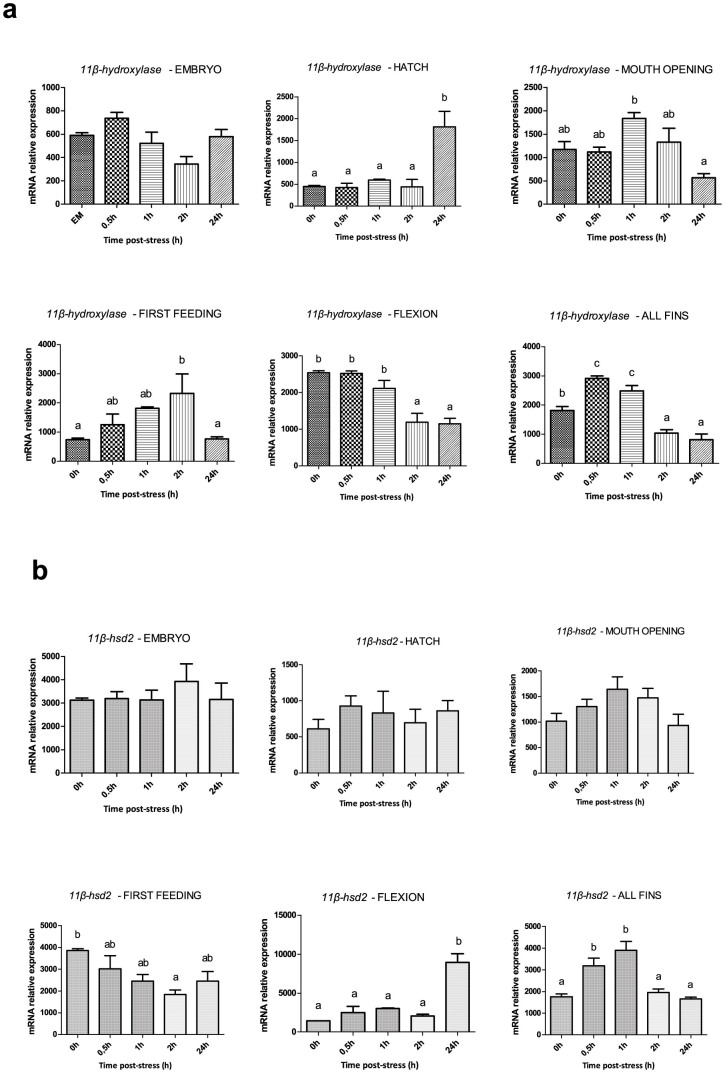
Figure 6. Expression of 11β-hydroxylase and 11β-hsd2 after application of a stressor during early ontogeny.
(a) Expression profile of 11β-hydroxylase prior to (0 h) and after (0.5 h, 1 h, 2 h and 24 h) the application of the stressor at the different developmental points/stages. (b) Expression profile of 11β-hsd2 prior to (0 h) and after (0.5 h, 1 h, 2 h and 24 h) the application of the stressor at the different developmental points/stages. Values are means ± standard error (n = 3). Means with different letters differ significantly from one another (P < 0.05).

