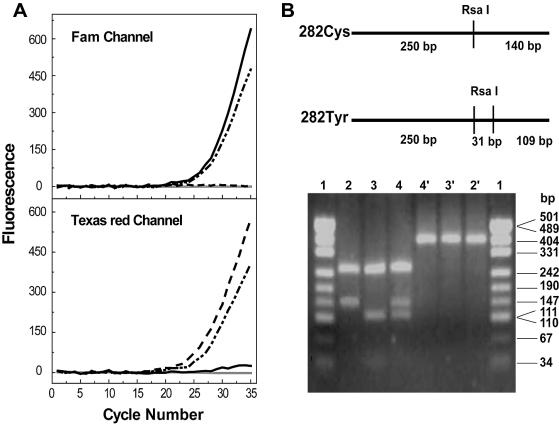
Figure 5.
(A) Real-time PCR genotyping of HFE. Typical genotyping results were from four PCRs with wild-type (black solid line), mutant type (dashed line), heterozygous templates (dash-dotted line) and negative control (gray solid line) respectively. The color of the fluorescence that developed during PCR identified each of the three genotypes. (B) PCR–RFLP results. The upper panel showed the restriction sites located in the wild-type amplicon (282Cys) and mutant amplicon (282Tyr). The lower panel shows the electrophoresis results of different amplicons treated or not treated with RsaI. The wild-type PCR product (lane 2) was cleaved into two fragments, 250 and 140 bp; the mutant product (lane 3) was cut to three fragments, 250, 111 and 29 bp (note: the 29 bp fragment band is hardly visualized in this figure); and the heterozygous product (lane 4) was digested into four fragments. Lanes 2′, 3′, and 4′ showed the corresponding undigested product of the wild-type, mutant and heterozygous type, all of which were 390 bp. Lane 1 and 1′ were pUC19-MspI (HapII) markers.

