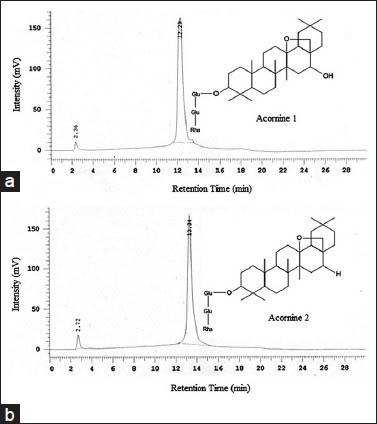
Figure 2.

Analytical HPLC (c18, 5 μM, 250 × 4.6 mm, UV detector) chromatograms of Acornine 1 (a) and Acornine 2 (b) isolated from the bark of A. corniculatum. Spectral data were recorded at 254 nm. Purity of both compounds was determined using the area and area% of the peaks, automatically calculated by the HPLC system software. Both Acornine 1 and 2 are in sufficient state of purity (more than 98% and 95% respectively) for structure determination
