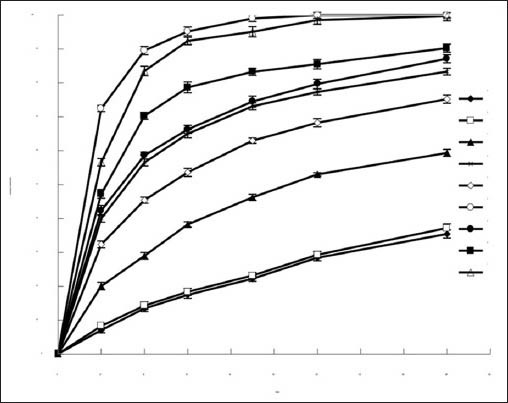
Figure 1.

The dissolution profiles of (a) TSIIA, (b) TSIIA/nano-CaCO3/ poloxamer 188 (1/5/4, PMs) and bSDs at different ratios of (c) TSIIA/ nano-CaCO3 (1/5), (d) TSIIA/nano-CaCO3 (1/9), (e) TSIIA/poloxamer 188 (1/3), (f) TSIIA/poloxamer 188 (1/9), and tSDs at different TSIIA/ nano-CaCO3/poloxamer 188 ratios of (g) TSIIA/nano-CaCO3/poloxamer 188 (1/7/2), (h) TSIIA/nano-CaCO3/poloxamer 188 (1/6/3), (i) TSIIA/ nano-CaCO3/poloxamer 188 (1/5/4). Each point represents the mean ± SD (n = 3)
