
Figure 11.
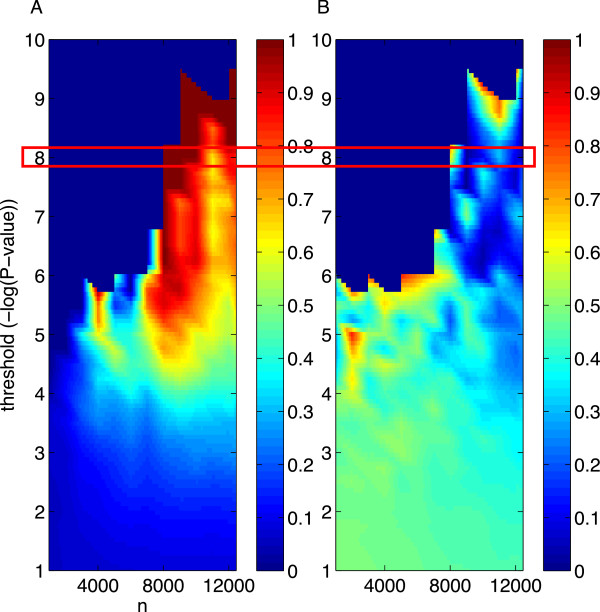
Measures of recovery using marginal regression (standard GWAS) as a function of sample size. All SNPs surviving the chosen − log10P − value threshold were selected. The recovery measures, computed over the selected SNPs, were (A) the adjusted positive predictive value (PPV*) and (B) the median P -value divided by the P -value cutoff. Highlighted in red is the cutoff we used for MR in Figure 10.