
Figure 1.
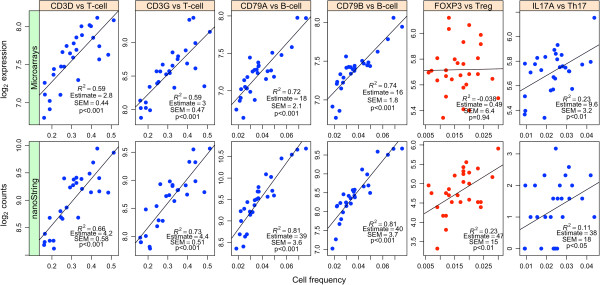
Scatter plots of immune cells quantified using DNA methylation analysis with the corresponding cell-specific gene expressions profiles. x-axis: relative cell-type frequencies of T, B, Treg and Th17 cells in whole blood; y-axis: a) top row: gene (CD3D, CD3G, CD79A, CD79A, FOXP3, and IL17A) expression intensities measured using microarrays and b) bottom row: gene expression counts measured using nCounter Elements from nanoString.