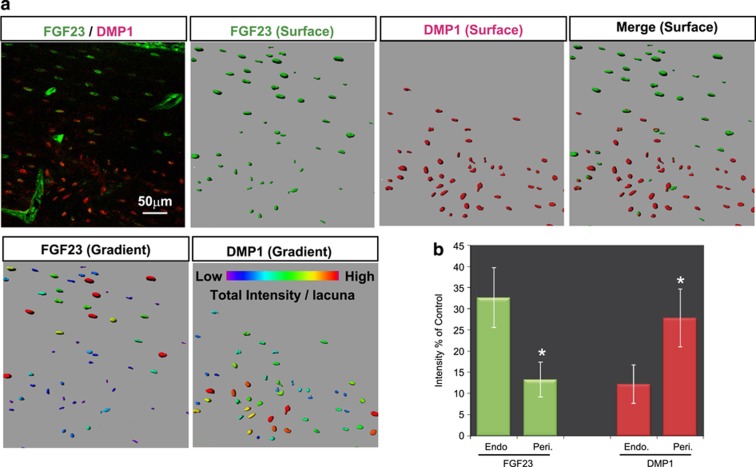
Figure 2.
Distinct spatial distributions and relative expression levels of FGF23 and DMP1 on three-dimensional (3D) immunofluorescence morphometry. (a) Representative confocal 3D-reconstituted images of the confocal z-series slices stained with double immunofluorescence FGF23 (in green) and DMP1 (in red) obtained from the femurs of 16-week-old rats. Scale bar: 50 μm. Easy 3D fluorescence image (upper left), surface rendering images of FGF23 (in green), DMP1 (in red) and their merged image are shown. The relative expression levels of FGF23 and DMP1 are demonstrated by graded colors (lower panels). Scale bar: 50 μm. Endosteal side is up. (b) The relative fluorescence intensity of FGF23 and DMP1 in the endosteal (Endo) portion and periosteal (Peri) portion was statistically compared. *endosteal vs periosteal, P<0.05. The data are representative of at least three independent experiments.

