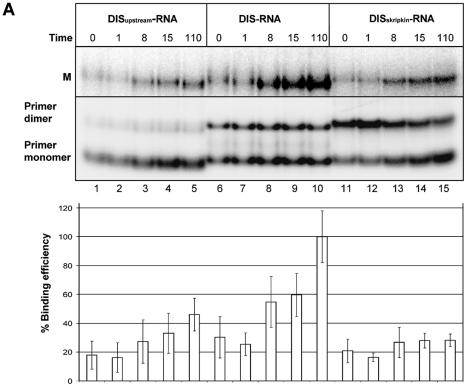
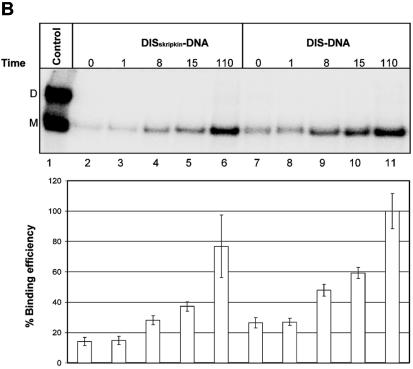
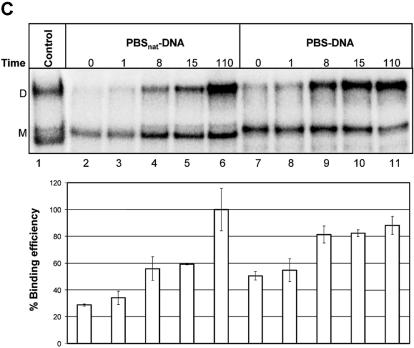
Figure 6.
Binding analysis of the selected oligonucleotides to HIV-1 RNA. Non-labelled HIV-1 leader RNA (+1–355) was incubated in the presence of the indicated radiolabelled oligonucleotides that include (A) DISupstream–RNA (lanes 1–5), DIS–RNA (lanes 6–10) and DISSkripkin–RNA (lanes 11–15), (B) DISSkripkin –DNA (lanes 2–6) and DIS–DNA (lanes 7–11) and (C) PBSnat–DNA (lanes 2–6) and PBS–DNA (lanes 7–11). See Table 2 for sequences. The samples were incubated for the indicated time period (min) before being subjected to native gel electrophoresis. The relative binding efficiency of labelled oligonucleotide to the HIV-1 leader RNA was calculated from three independent experiments as the sum of counts in the monomer and dimer bands normalized in each experiment to the maximum binding observed at the last time point. (A) The bands corresponding monomeric and dimeric RNA oligos were investigated by running the same samples in a 12% polyacrylamide native gel (lower autoradiogram). Radiolabelled HIV-1 RNA was included as a marker in panels B and C. The positions of dimeric (D) and monomeric (M) RNA species are indicated.


