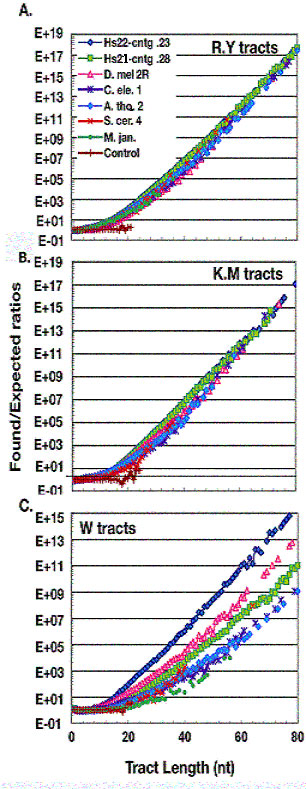
Figure 2.

The over-representation of binary tracts in chromosomes of six organisms. The log ratios of found to expected number of binary tracts are plotted against tract length. Control runs are the same as in Fig. 1. Tracts up to 80 nt are plotted. The symbols for the seven chromosomes are given on the figure. A R.Y tracts. B K.M tracts. C W tracts
