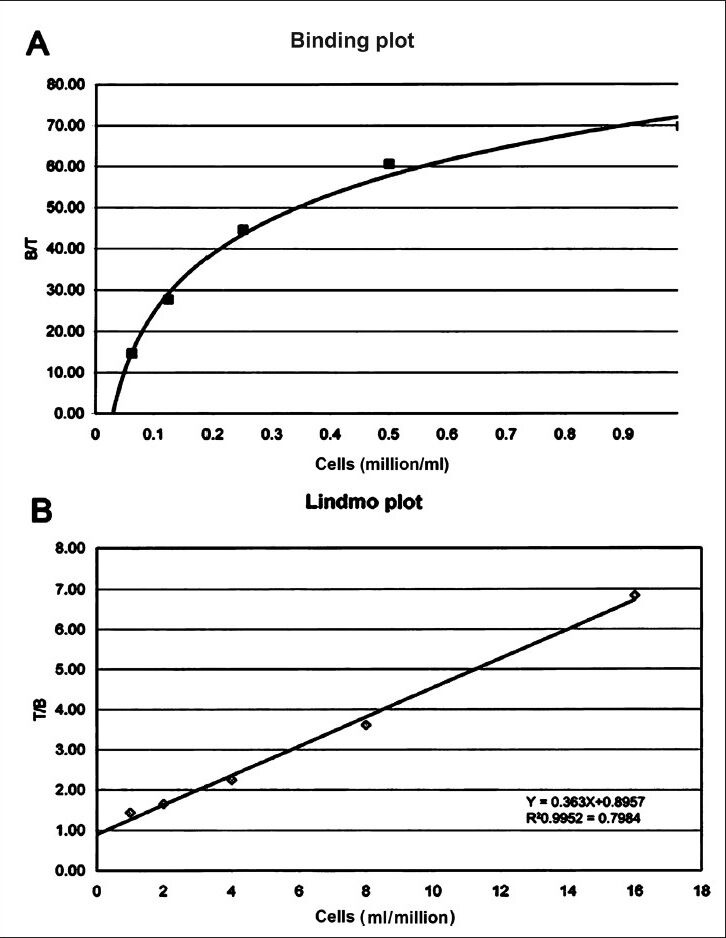
Fig. 6.

Binding plot (A) of the ratio of specifically bound radiolabelled antibody to the total applied radioactivity (B/T) as a function of cell concentration (X-axis). The cell concentration is expressed as cells (million/ml). Lindmo plot (B) showing total/bound activity as a function of inverse of cell concentration expressed as 1/cells (ml/million).
