Fig. 7.

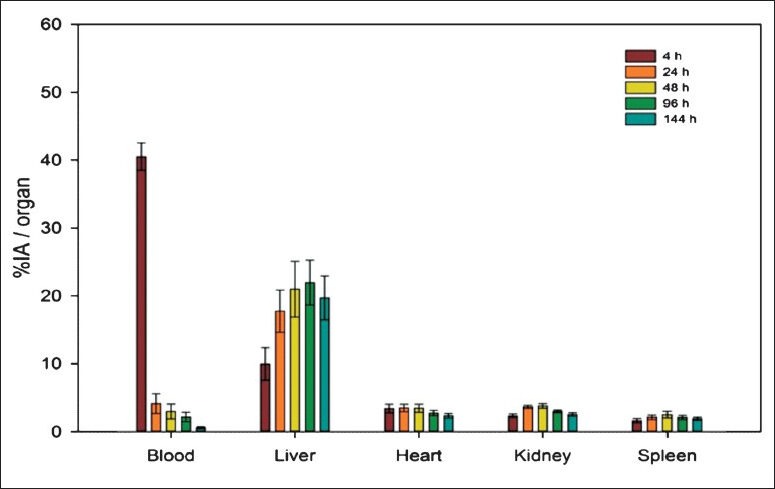
Bar diagram with error bars (mean ± SD) showing percentage injected activity (% IA) for blood, liver, heart, kidneys and spleen in the patients (n=3).

Bar diagram with error bars (mean ± SD) showing percentage injected activity (% IA) for blood, liver, heart, kidneys and spleen in the patients (n=3).