
Figure 2.
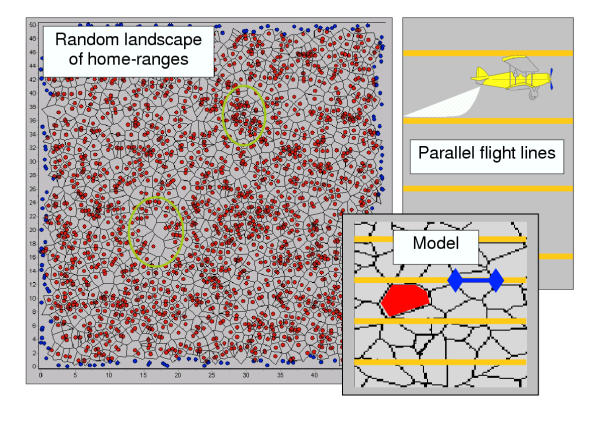
Schematic representation of the model Schematic representation of the components of the model: Randomly generated landscape of fox group home-ranges (including high and low density areas), the parallel flight lines randomly intersected with the 'fox landscape', and the measurements in the model (i) length of flight line segment in each polygon, (ii) number of empty polygons.