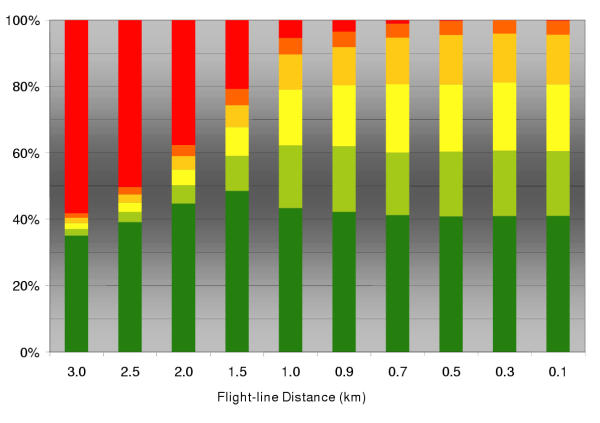
Figure 6.

The effect of varying flight line distance The effect of varying flight line distance (i.e. management strategy) on the distribution of absolute bait numbers in the individual fox groups under the field strategy (pBaitDens = 20; mean fox group area ~1 km2). Bar segments depict the percentage of spatial units with a particular number of baits (red 0; orange 1–5; light orange 6–10; yellow 11–15; green 16–20; dark green > 20 baits). Very small flight line distances cannot improve the ground pattern further, as small sized home-ranges can only contain a maximum number of baits even with perfectly uniform distribution.
