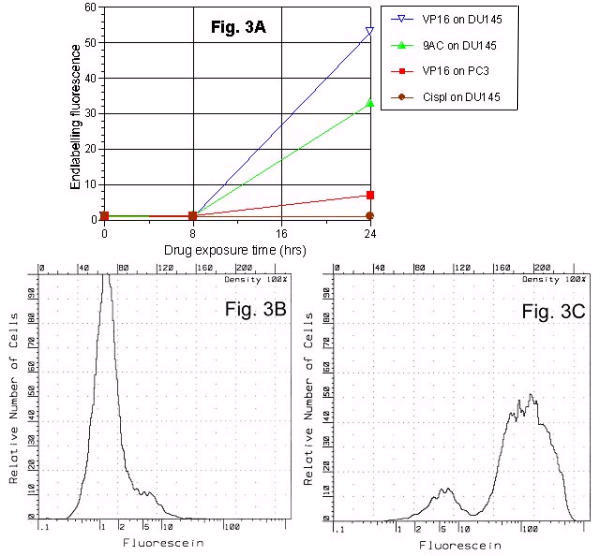
Figure 3.

Dependence of DNA fragmentation on drugs and cell lines. Using the APO-BRDU endlabelling technique evaluated various antineoplastic agents (VP16 etoposide, 9-amino-camptothecin, cisplatin) at various times (8 and 24 hrs). Graph displays the fluorescent intensity (per 10000 cells) during different experimental conditions (3A) and illustrate that, at standard tissue culture doses: i) there was a minimal response at 8 hrs; ii) a range of responses for a given cell lines (DU145 response was highest with VP16, and not detectable with cisplatin); and, iii) for same drug and dose (VP16 at 10 μg/ml) DU145 response was greater than for PC3. Sample histograms showed fluorescence intensity distribution for untreated control cells (3B) and after a 24 hours VP16 treatment (3C).
