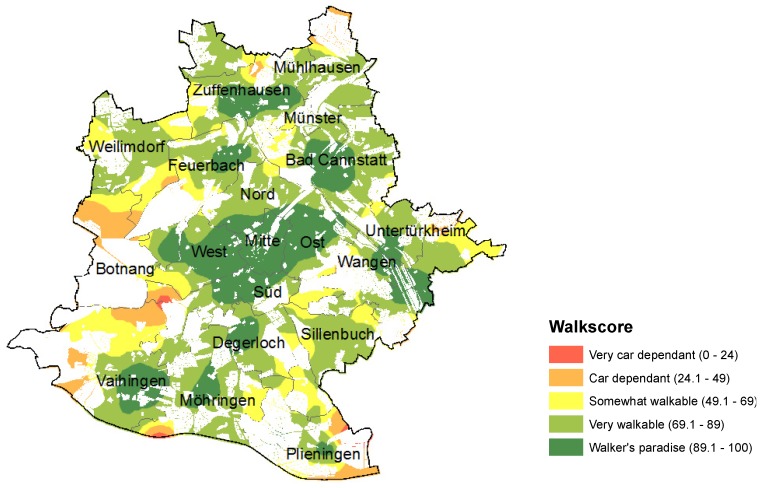
Figure 3.
Walk Score for Stuttgart.
Notes: Data sources: geostreet+ 2010; infas Wohnquartiere 2010; Automatisiertes Liegenschaftskataster (ALK 2008); Parks: Amtliches-Topographisch-Kartographisches Informationssystem (DLM25 2011); Yellow Pages (other facilities). Cartography: Heat map using the ArcGIS 10 GeostatisticalAnalyst method, diffusion kernel (500 m bandwidth), using uninhabited blocks as barriers and the number of households as weights.

