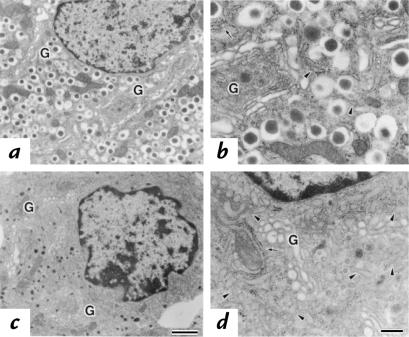
Figure 5.
Ultrastructural morphology of the islets. Electron micrographs of the β cells were taken from either C57BL/6J (a and b) or Mody (c and d) mice. Parts b and d represent higher magnification of a and c, respectively. Arrows indicate the rough ER, arrowheads represent the transitional ER, and G indicates the Golgi apparatus. Bar, 1 μm (a and c); Bar, 0.25 μm (b and d). ER, endoplasmic reticulum.

