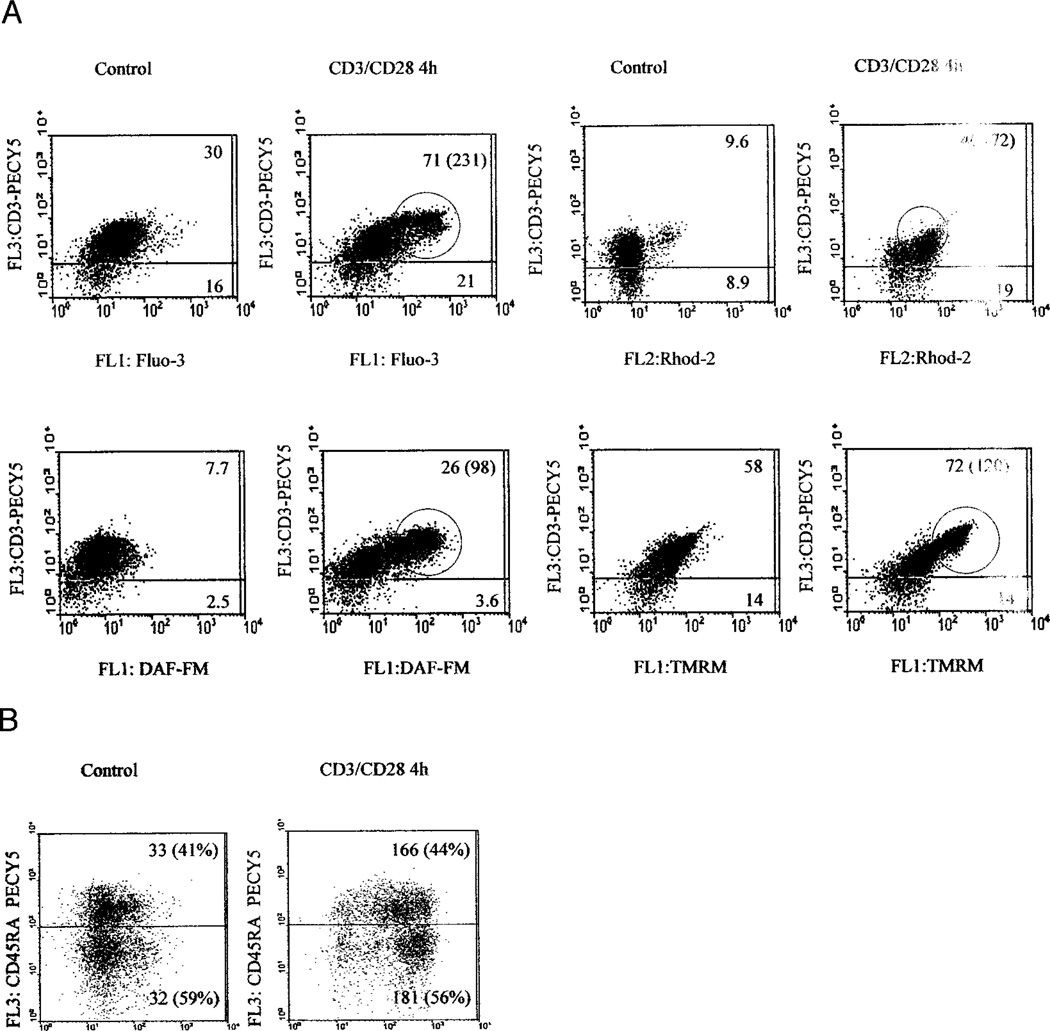
FIGURE 2.
A, Mitochondrial hyperpolarization is associated with increased NO production in T cells. Following CD3/CD28 costimulation, Δψm was measured by TMRM fluorescence (FL-2), cytoplasmic and mitochondrial Ca2+ levels were assessed by Fluo-3 (FL-1) and Rhod-2 fluorescence (FL-2), whereas NO production was monitored by DAF-FM fluorescence (FL-1). T cells were detected by staining with PE-Cy5-conjugated anti-CD3ε mAb UCHT1 (FL-3). Values in dot plots indicate mean channel fluorescence of CD3+ and CD3− cells, respectively. Values in parentheses correspond to encircled high-mean channel fluorescence population within the CD3+ T cell compartment, observed upon CD3/CD28 costimulation; B, Following CD3/CD28 costimulation, NO production was monitored by DAF-FM fluorescence (FL-1), and CD45RA T cells were detected by staining with PE-Cy5-conjugated anti-CD45RA mAb (FL-3).

