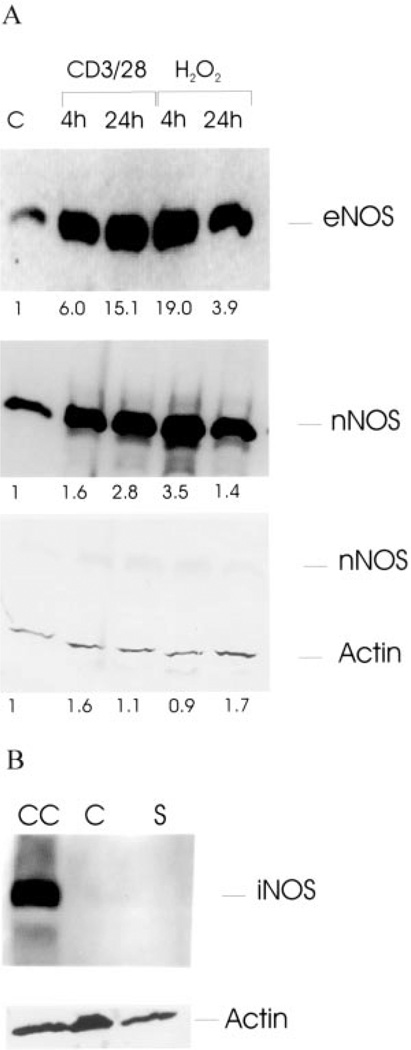
FIGURE 6.
A, Western blot analysis of eNOS and nNOS expression in response to CD3/CD28 costimulation or treatment with 100 µM H2O2. Twenty micrograms of protein lysates were loaded in each lane, separated in a 7.5% SDS-PAGE gel, transferred to nitrocellulose, and probed with Abs specific for NOS isoforms eNOS and nNOS. Subsequently, blots were reprobed with control Ab to human β-actin. Values below lanes indicate relative expression of NOS isoforms in CD3/CD28- or H2O2-treated vs control PBL (C) calculated by automated densitometry using β-actin levels as baseline; B, Western blot analysis of iNOS expression in control (C) and CD3/CD28 costimulated PBL (S). CC, Chondrocyte protein lysate used as positive control for iNOS expression. Subsequently, the blot was reprobed with control Ab to human β-actin.

